Gamma Exposure (GEX) is a measure of how option market makers' hedging activity affects the price of the underlying stock or index. When traders buy and sell options, dealers on the other side of those trades hedge continuously to stay delta-neutral. The scale of that hedging is dictated by gamma — and it's large enough that it moves prices, especially around specific strikes and expirations. GEX quantifies this.
For directional traders, GEX is one of the few tools that explains intraday market behavior rather than just describing it after the fact.
What gamma does, in one paragraph
An option's delta measures its sensitivity to the underlying price. Gamma measures how fast delta changes as the underlying moves. A call option might have a delta of 0.30 at a stock price of $100 — meaning the call gains $0.30 for each $1 the stock rises. But as the stock moves to $105, the delta might be 0.60. That change in delta — from 0.30 to 0.60 — is what gamma captures. Gamma is second-order, accelerating.
Market makers — the dealers who sell options to retail traders — hedge their positions by buying or selling the underlying stock. When gamma is large, their hedging needs to be large too, and continuous.
Why dealer hedging moves prices
Market makers are structurally short gamma when they sell calls and puts to the market. Short gamma means: as the stock rises, their position delta falls (they need to buy more stock to stay hedged); as the stock falls, their position delta rises (they need to sell stock to stay hedged).
Short-gamma hedging is destabilizing. It forces dealers to buy when prices are rising and sell when prices are falling — the opposite of contrarian behavior. This creates or amplifies trends.
Long-gamma hedging is stabilizing. When dealers are net long gamma (they've bought more options than they've sold, net), their hedging runs the other way — they sell into strength and buy into weakness. This dampens moves.
The market as a whole alternates between these regimes. Knowing which regime you're in — and where the regime changes sit — is what GEX tells you.
The three key levels GEX identifies
Once you aggregate option positions across all strikes and expirations for a ticker, GEX reveals three specific price levels that matter:
Gamma Flip
The price level where net dealer positioning transitions from long-gamma (stabilizing) to short-gamma (destabilizing), or vice versa. Crossing this level usually changes the character of intraday trading — volatility often expands on a flip from long- to short-gamma.
Call Wall
The strike with the largest net positive gamma exposure from call open interest. Price often stalls when approaching the Call Wall from below, because dealers' hedging pushes back against the move. Breakouts above the Call Wall are structurally significant.
Put Wall
The strike with the largest net positive gamma exposure from put open interest. Similar role as the Call Wall, but on the downside. Prices approaching the Put Wall from above often find support; breakdowns below are structurally significant.
Deep dive on these three: Understanding call walls, put walls, and gamma flip.
How QuantWheel's GEX suite visualizes this
The GEX category in the sidebar is a suite of tools, each showing gamma exposure from a different angle:
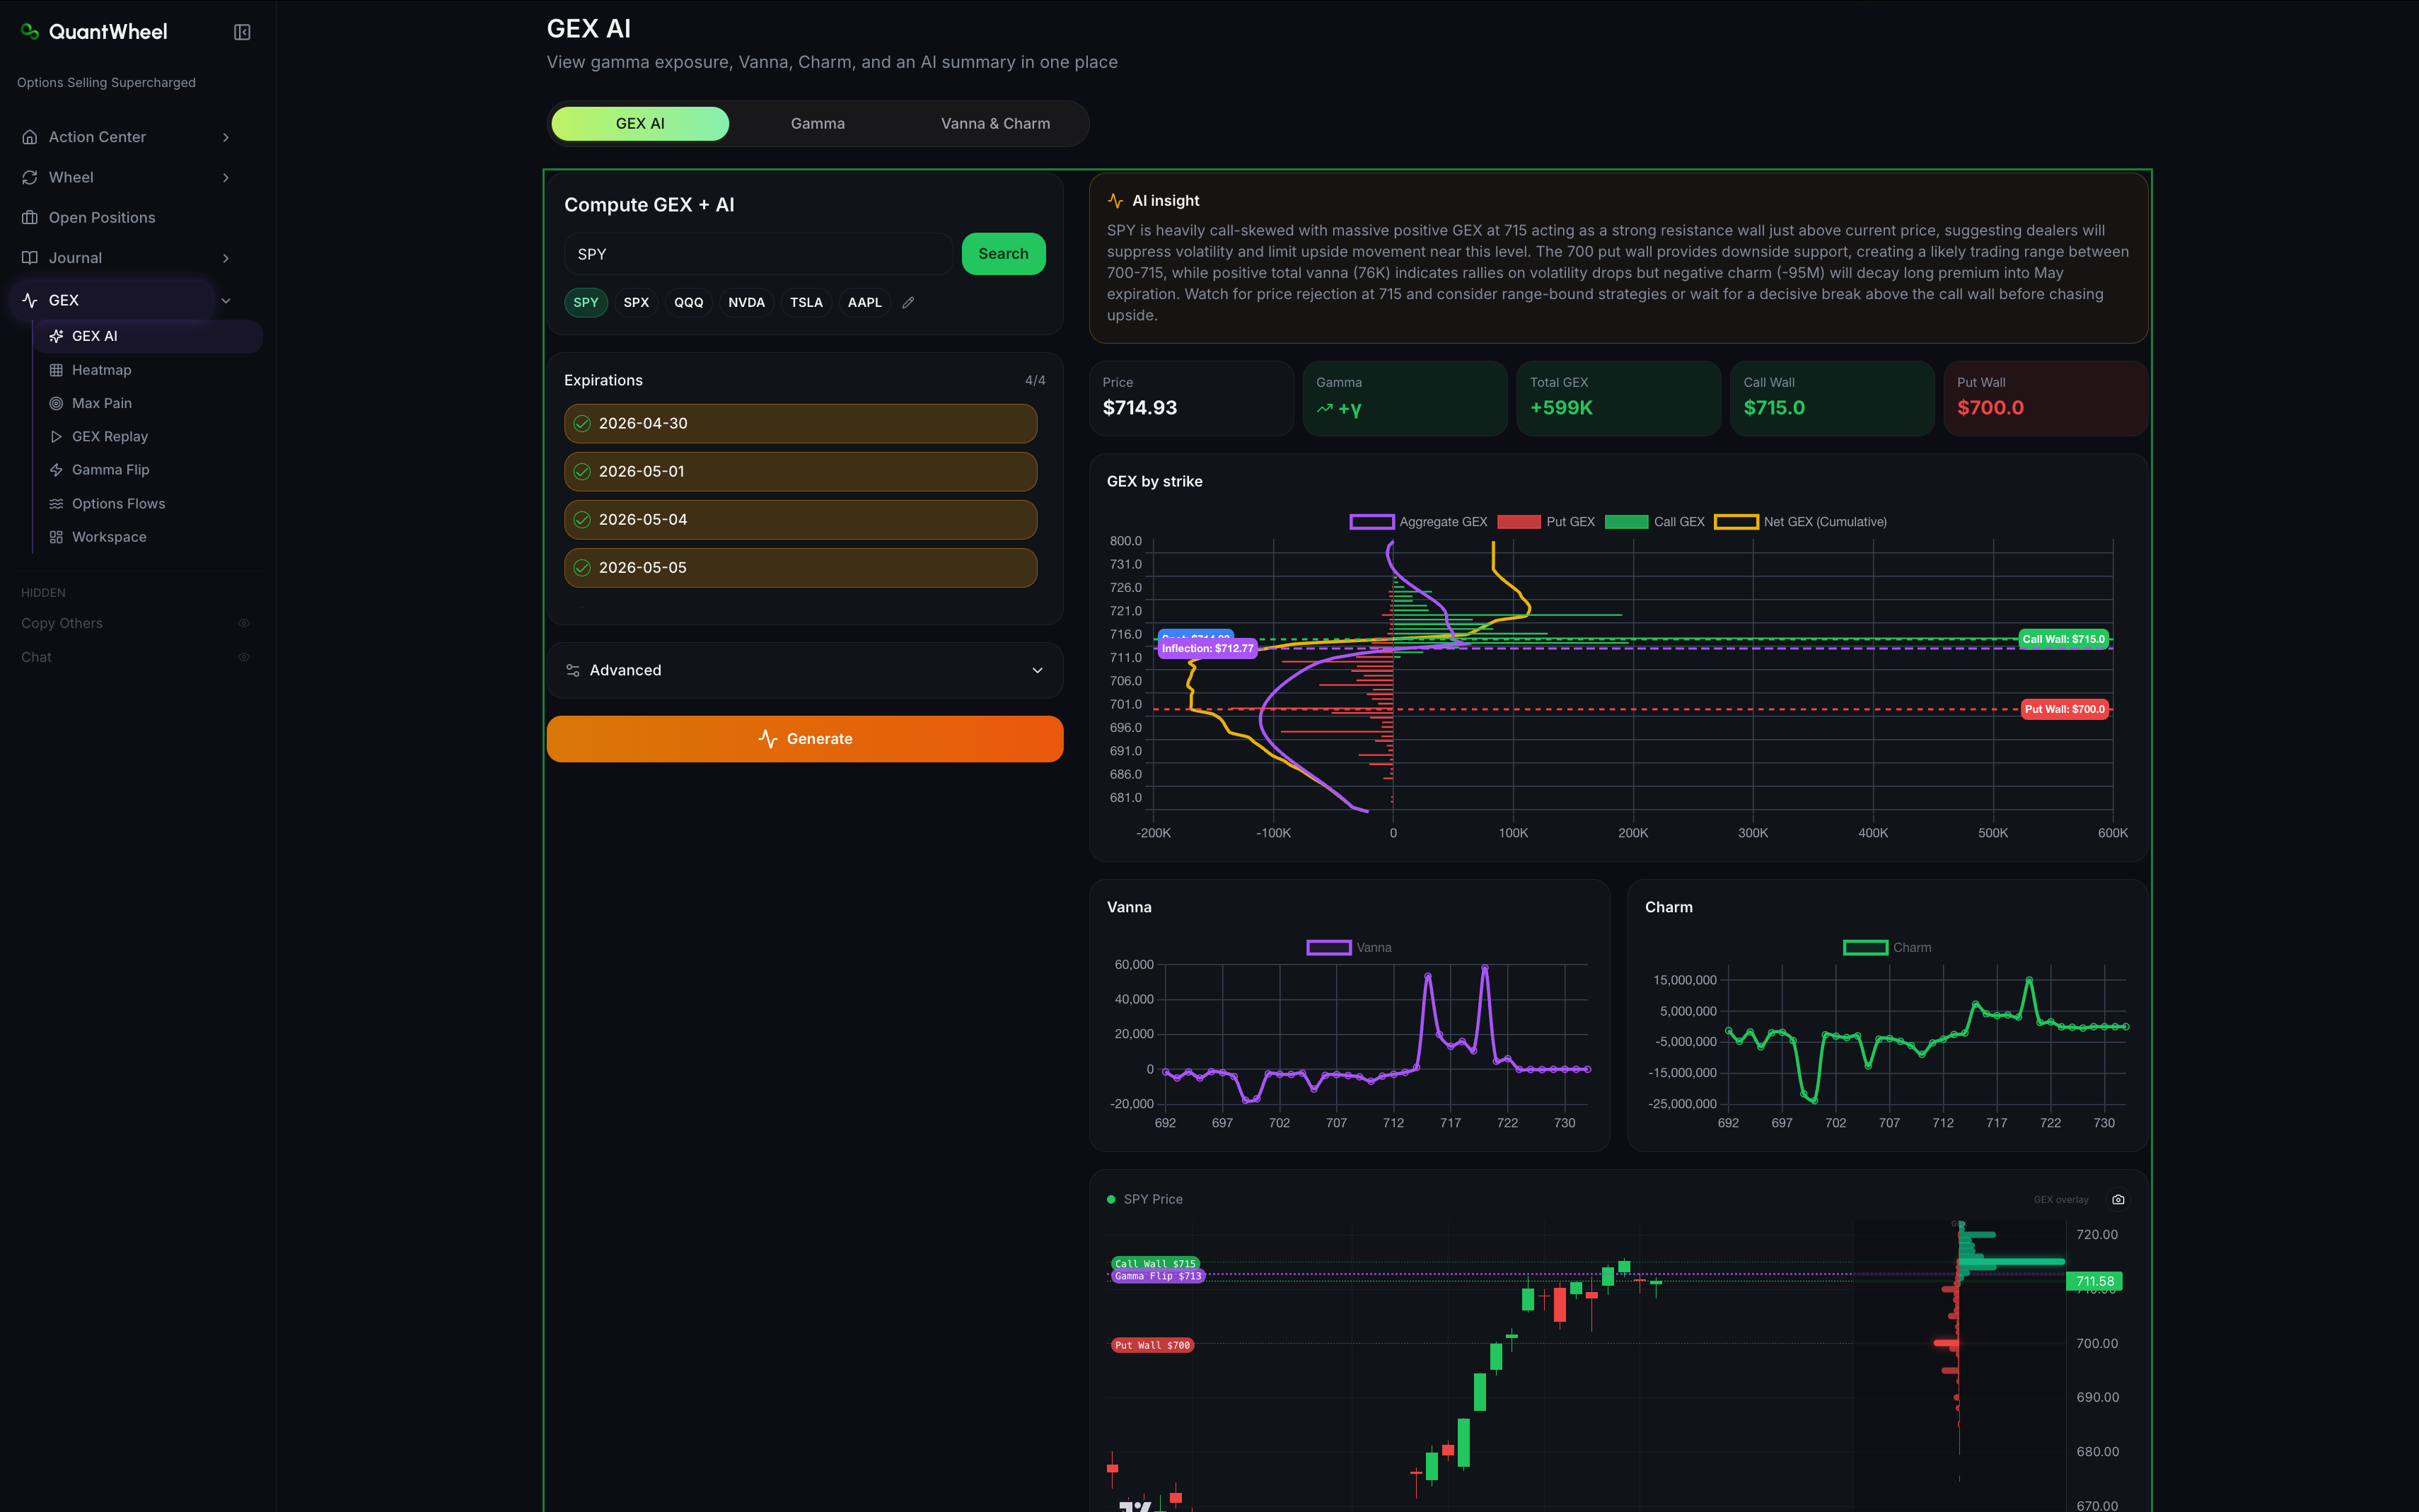
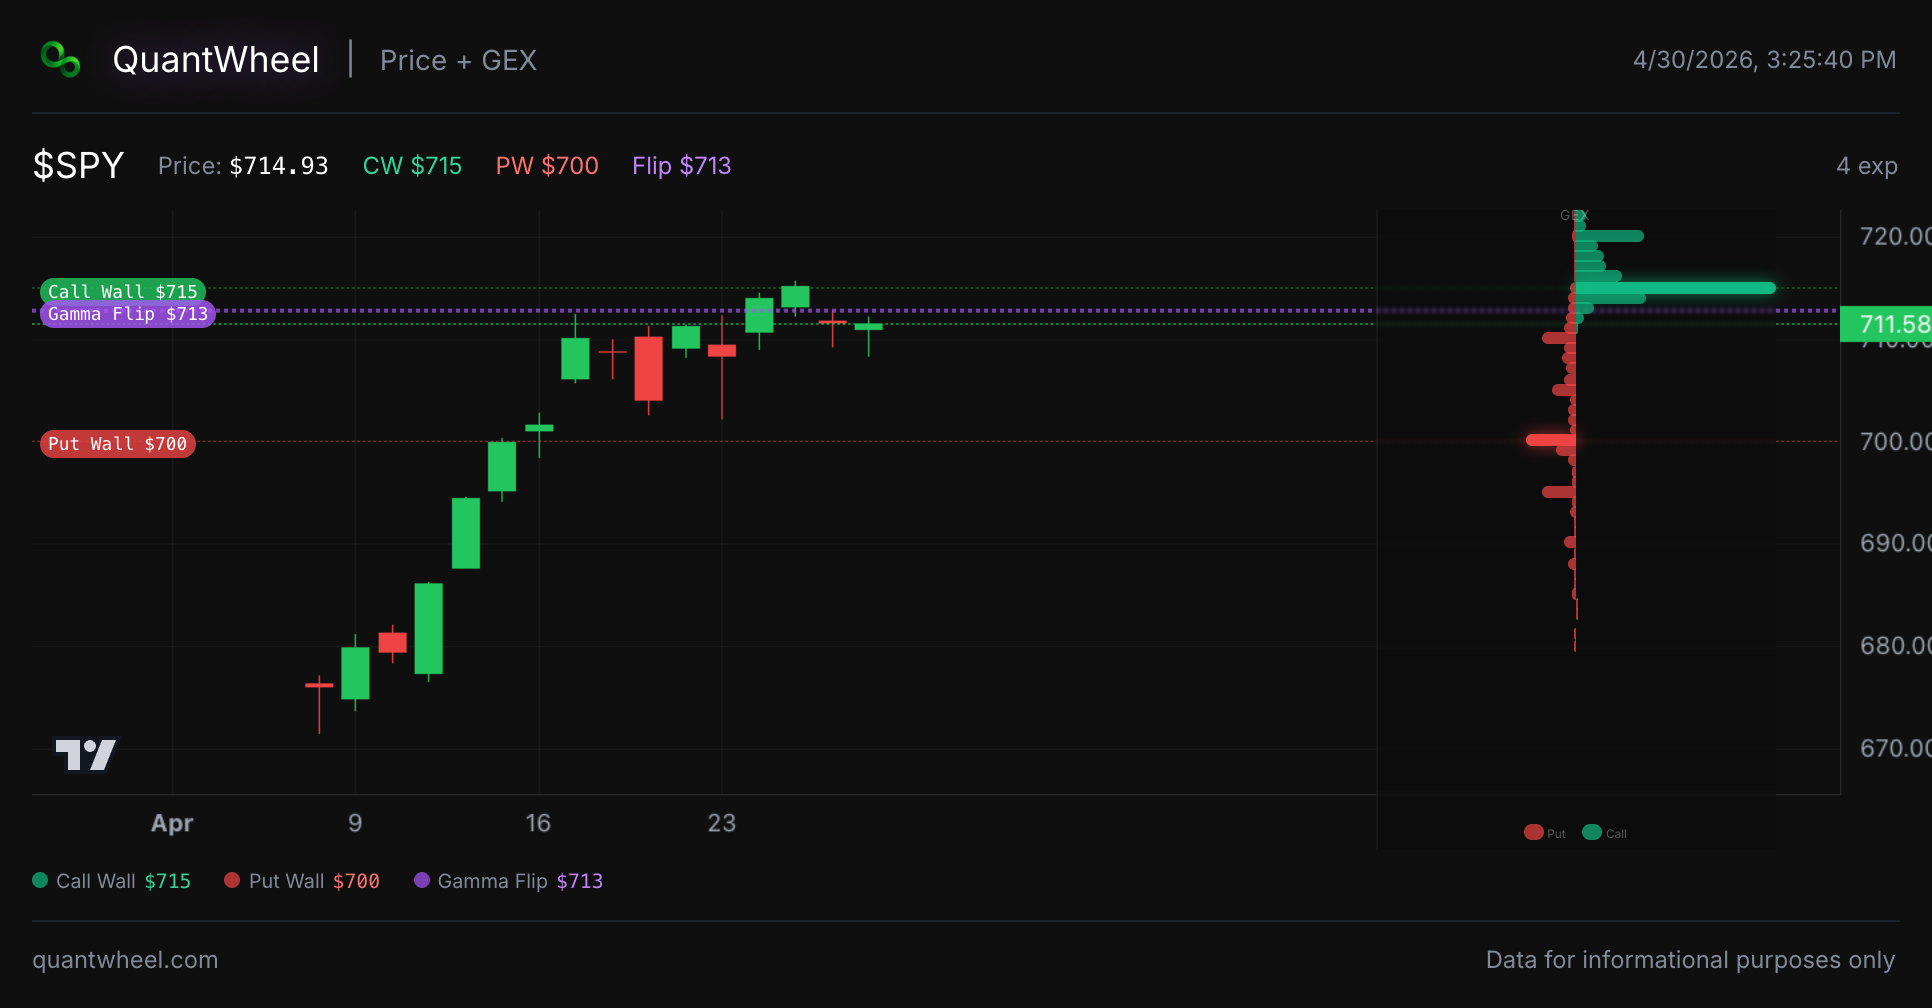
GEX AI combines the key metrics into a single ticker dashboard with AI-generated commentary. How to use GEX AI for a ticker.
GEX Heatmap shows gamma exposure across strikes and expirations as a 2D heatmap. Best for spotting clusters of dealer positioning. How to read the GEX Heatmap.
Max Pain shows the strike at which the largest number of open contracts would expire worthless. Often (but not always) a magnet price into expiration. How to find max pain strikes.
GEX Replay plays back historical intraday GEX alongside price action, so you can see how dealer positioning evolved through a past session. How to replay historical GEX.
Gamma Flip tab tracks gamma-flip events and lets you set alerts for them. How to track gamma flip events and set alerts.
Options Flows shows live gamma-flow style activity for paid GEX users.
Workspace lets you pin widgets from any of the above into a custom dashboard. How to build a custom GEX Workspace.
Vanna & Charm are specialized second-order greeks views — how gamma changes with implied volatility (Vanna) and with time (Charm). How to read Vanna and Charm exposures.
Plan tier access
GEX data is tier-gated:
- Sandbox shows GEX with a delay for learning purposes
- QuantWheel GEX ($27/mo) unlocks real-time GEX, Walls, Gamma Flip alerts, Options Flows, Workspace, and Vanna & Charm
- QuantWheel PRO includes everything in GEX plus the wheel workflow
See Understanding QuantWheel plans for full tier details.
Common misconceptions
"GEX predicts prices."
GEX describes dealer positioning, not stock direction. It tells you where moves are likely to find support or resistance, and whether the current regime is trending or range-bound. It doesn't predict up or down.
"Higher GEX means more bullish."
High total positive GEX means dealers are net long gamma, so hedging will dampen moves. That can feel "stable" or "rangebound" — neither bullish nor bearish. A flip to negative GEX with dealers net short is when hedging amplifies moves; direction still depends on what triggers the move.
"The Call Wall is resistance."
The Call Wall is typically where dealer hedging slows down upside momentum, so it acts like resistance in the short term. But if price breaks through decisively, the hedging flips — dealers now need to buy more as price rises, which accelerates the move. A broken Call Wall often leads to a squeeze, not continued resistance.
"GEX matters on every stock."
GEX matters most on heavily-optioned tickers where dealer hedging is a meaningful share of order flow. SPY, SPX, QQQ, NVDA, TSLA, AAPL — major indices and the largest single-name option markets — are where GEX signal is strongest. On low-liquidity tickers, dealer hedging is a smaller share of volume and GEX matters less.
Related
- Understanding call walls, put walls, and gamma flip
- How to use GEX AI for a ticker
- Understanding QuantWheel plans: Sandbox, GEX, and PRO
Risk disclaimer: Options trading involves substantial risk of loss and is not suitable for all investors. Past performance does not guarantee future results. This content is for educational purposes only and is not investment advice.