GEX Replay — sometimes called PlayTape — lets you scrub through a past trading session and watch GEX metrics change alongside price action. Where GEX AI gives you a current snapshot, Replay gives you the motion picture: see how dealer positioning evolved through the session, watch the Gamma Flip move as flow shifted, see what happened when price approached the Call Wall or Put Wall.
It's the tool that most directly teaches GEX intuition — watching 5 real sessions teaches pattern recognition better than reading 50 articles about gamma hedging.
Before you start
Required:
- QuantWheel GEX or QuantWheel PRO subscription.
- Familiarity with GEX basics — see Understanding GEX and How to use GEX AI for a ticker first.
Time to complete: 10 minutes for your first replay; 5 minutes per replay thereafter.
Steps
1. Open GEX Replay
In the sidebar, open GEX → GEX Replay.
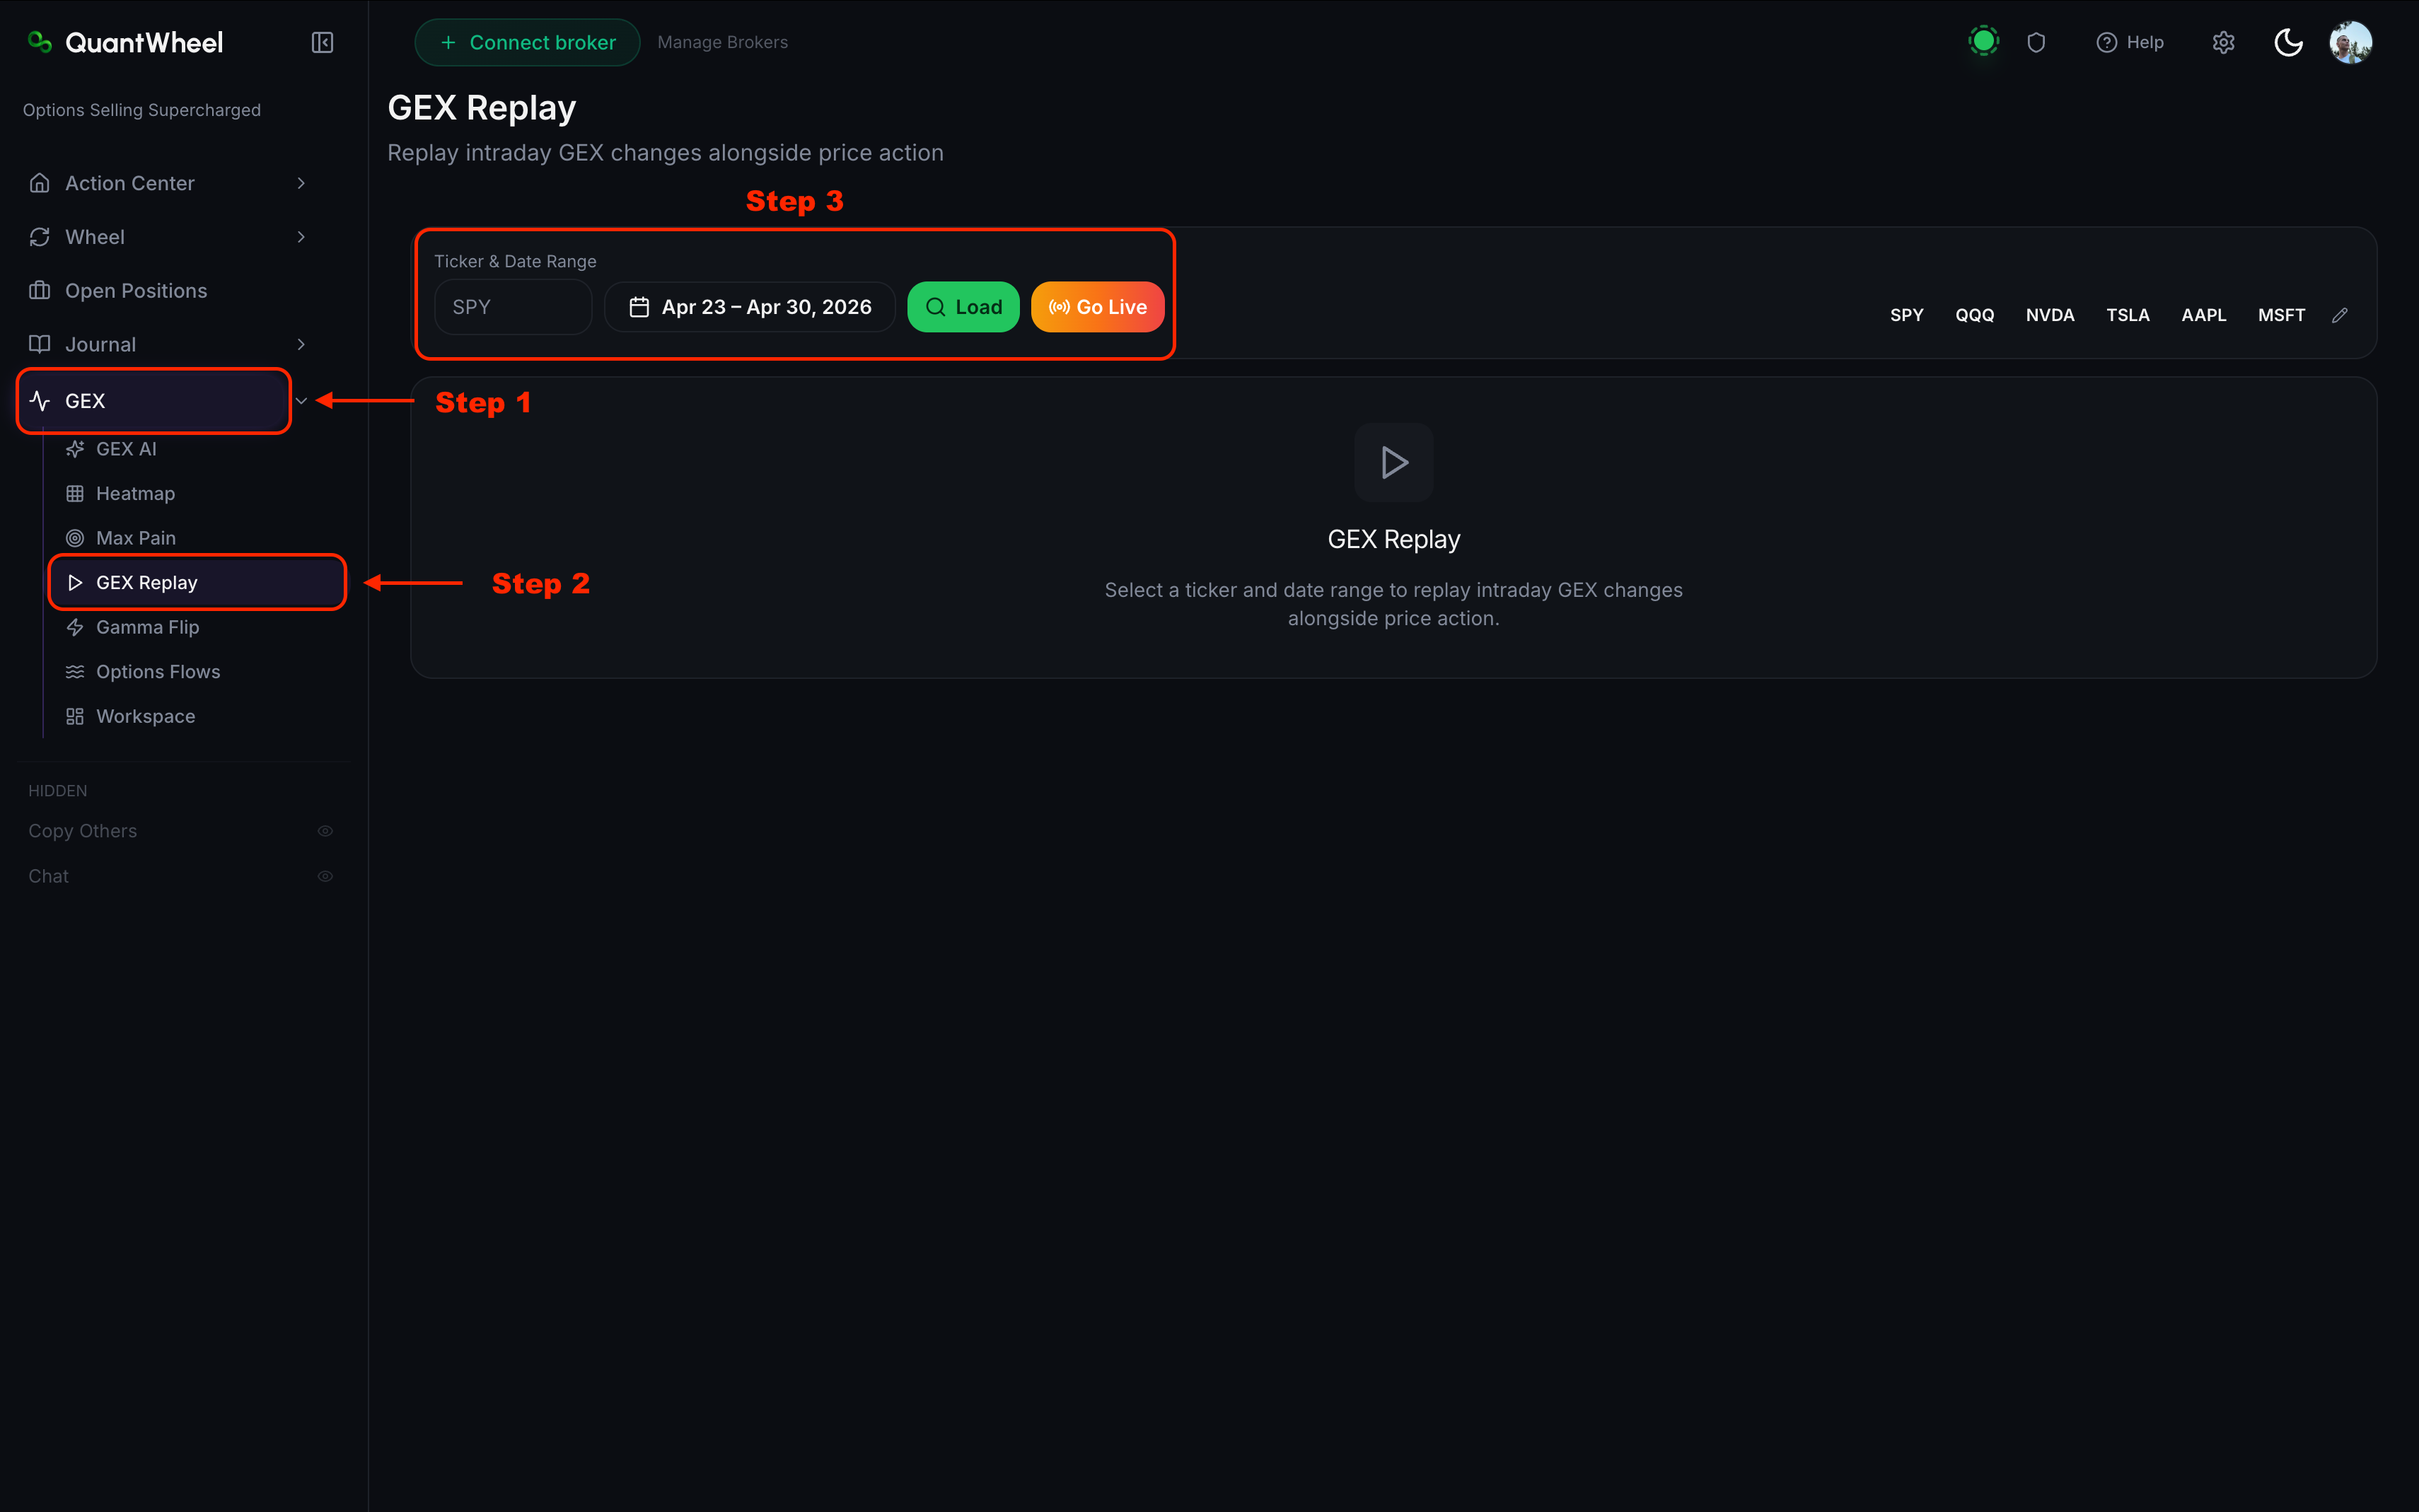
2. Select a ticker and a date
Enter the ticker in the ticker input (or use a popular-ticker shortcut: SPY, SPX, QQQ, NVDA, TSLA, AAPL). Then pick a date from the date picker. Any recent trading day is available; historical depth depends on your plan.
Good sessions for learning are ones with notable GEX events: a Gamma Flip during the session, a Call Wall breakout, a major intraday reversal, or a known news-driven day.
3. Set playback speed
Above the timeline, a speed selector offers 1x through 8x. Start at 1x for close study; move to 2x or 4x once you know what you're looking for. 8x is useful for quickly spotting the session's major moves before re-scrubbing at slower speed for detail.
4. Play, pause, and scrub
Standard playback controls sit below the timeline:
- Play / Pause — starts or stops the replay
- Skip forward / back — advance or rewind in fixed chunks (typically 5-15 minutes)
- Timeline scrubber — drag to jump to any minute of the session
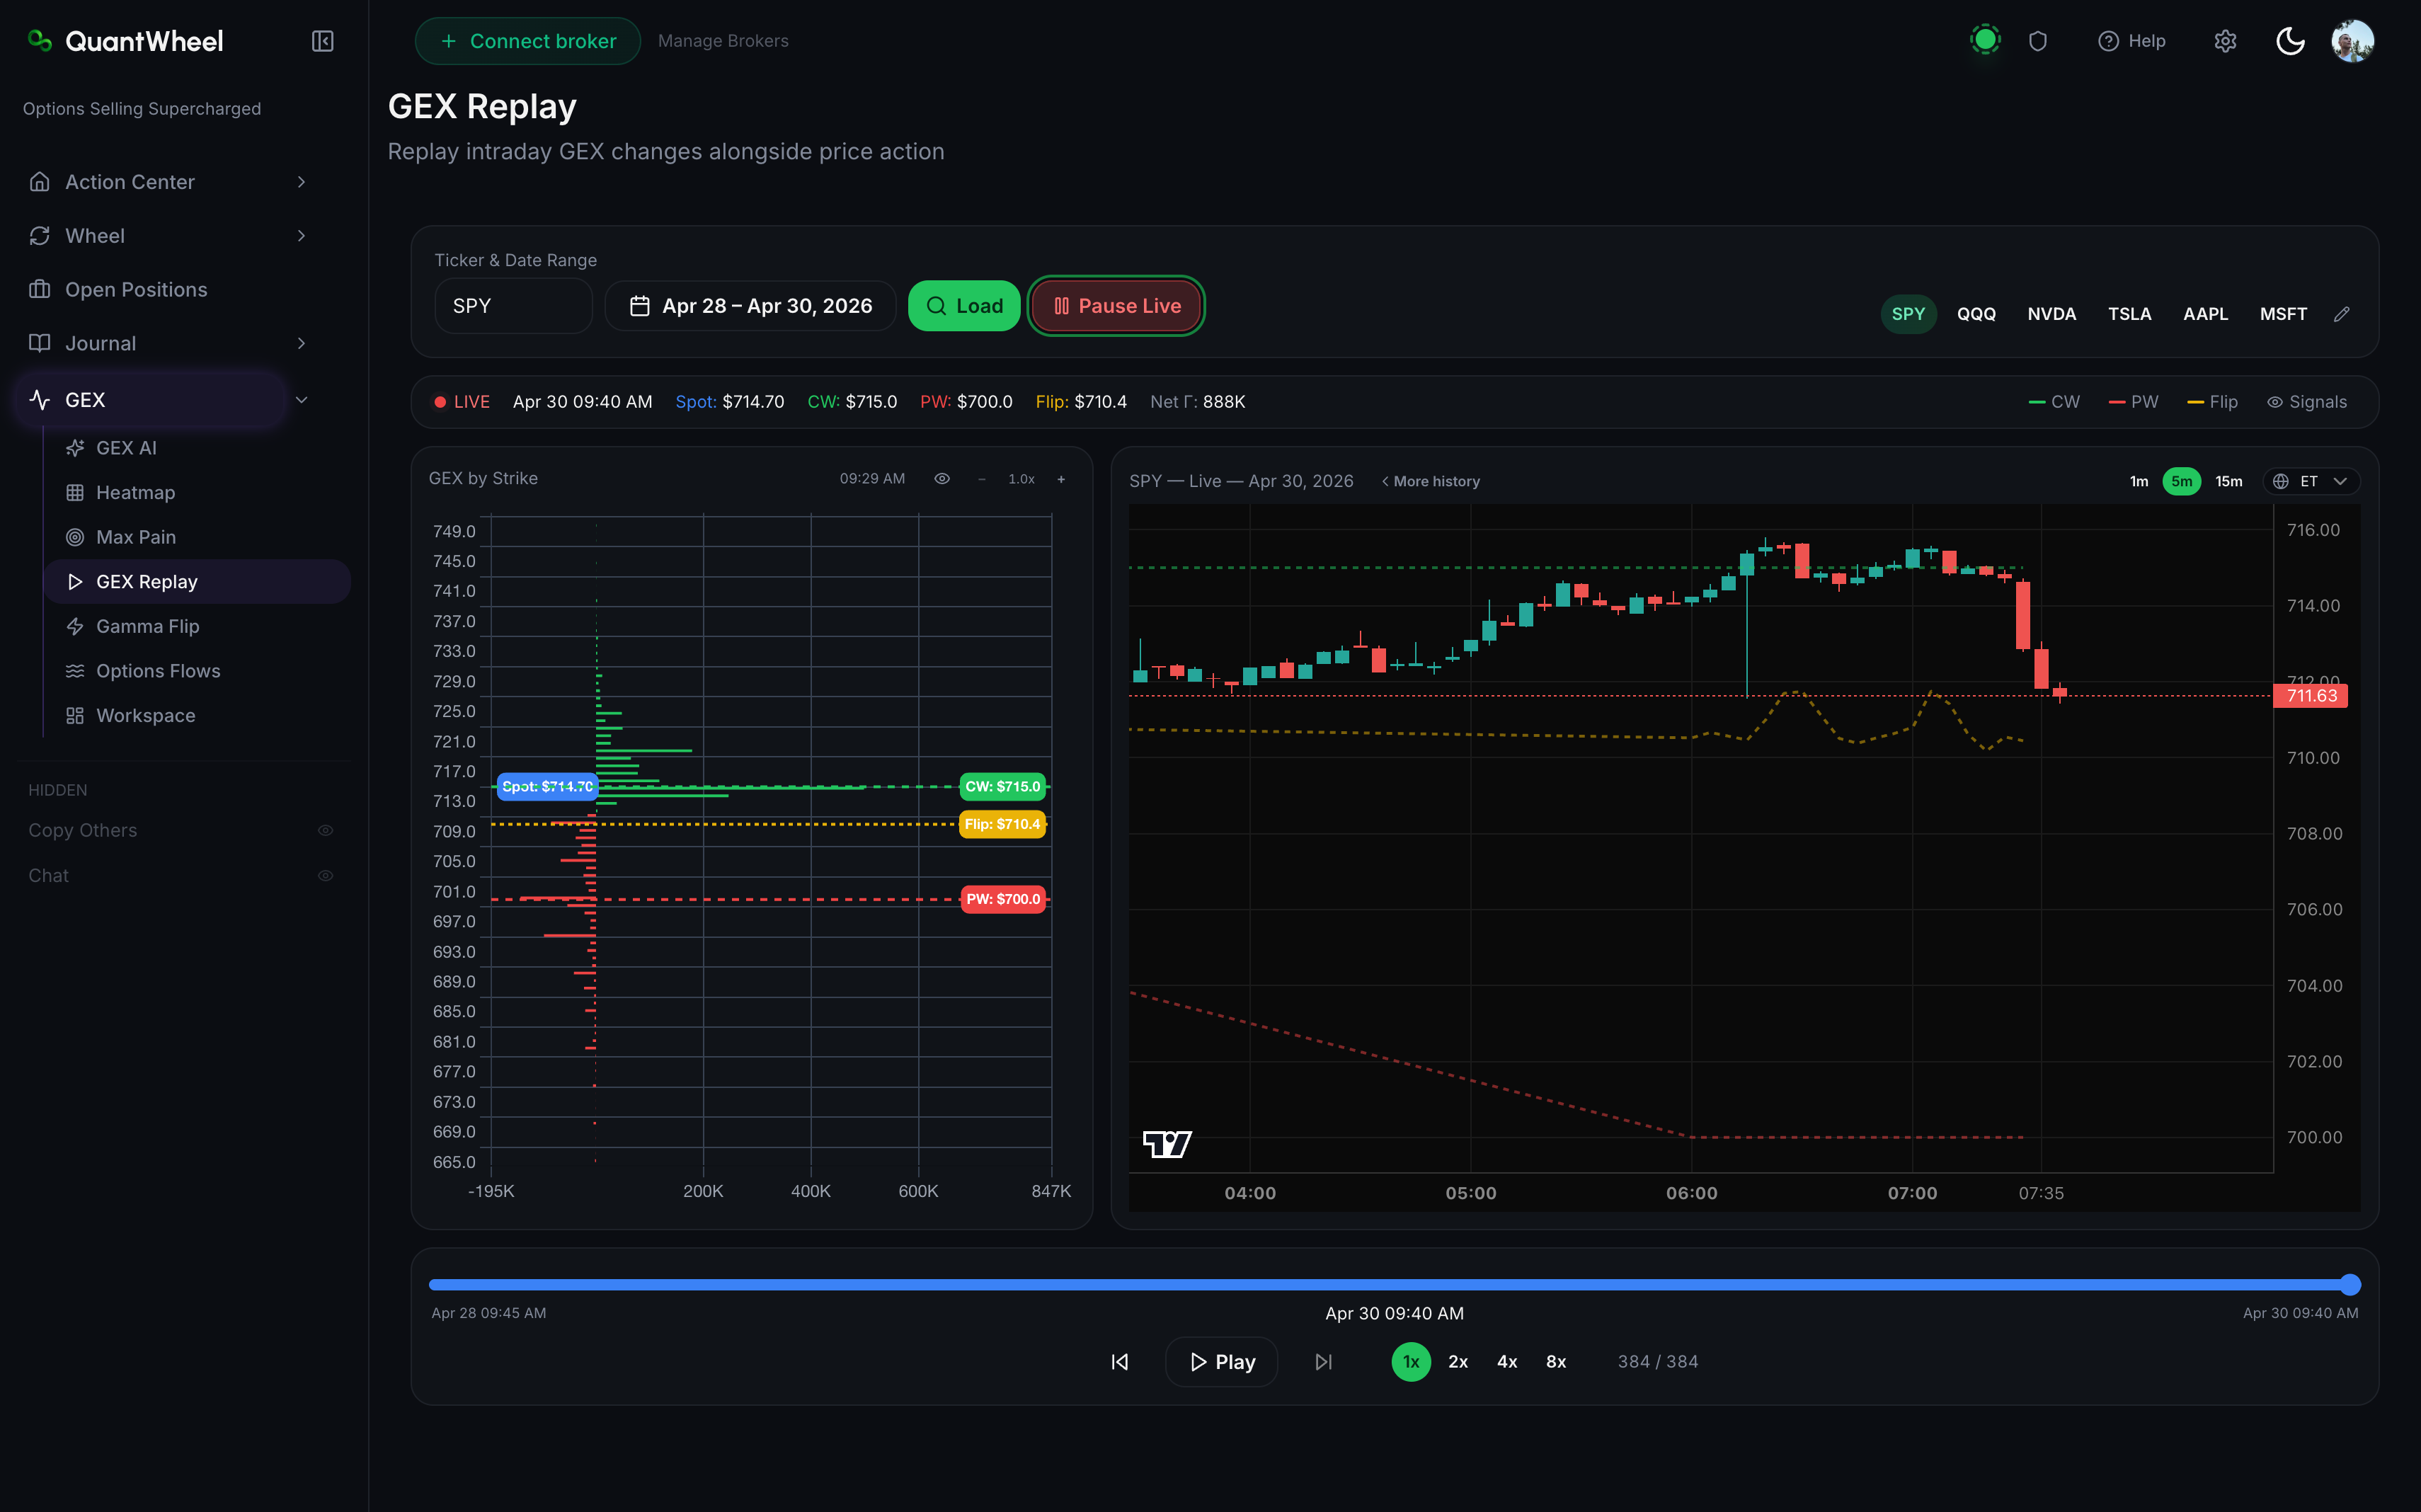
5. Read the two-chart layout
GEX Replay shows two synchronized charts:
Top: Price action. Candlestick chart of the underlying for the selected day. Horizontal lines overlay the Call Wall, Put Wall, and Gamma Flip as of the current playback timestamp — these update as you scrub, so you see how the levels themselves moved during the session.
Bottom: GEX by strike. The gamma-by-strike distribution at the current timestamp. As you play forward, bars grow and shrink as open interest changes. Large swings here often accompany notable intraday moves.
6. Watch the real-time metrics bar
Above or alongside the charts, a metrics bar shows the key numbers at the current playback time:
- Price
- Total GEX
- Net GEX by expiration
- Call Wall (strike and distance from current price)
- Put Wall (strike and distance)
- Gamma Flip (price level and regime label: "Long Gamma" / "Short Gamma")
Watch these update as you play. A quick 3-minute scrub of a full session makes the regime changes visually obvious.
How to use GEX Replay for learning
Study the morning setup
Start at market open. Note the pre-market Call Wall, Put Wall, and Gamma Flip. Ask: where did price sit relative to these? Which levels mattered most during the session?
Find the inflection moments
Scrub forward until you see a meaningful move (breakout, breakdown, reversal). Pause. Step back 15-30 minutes and play slowly. What was GEX doing as the move started? Did a wall break? Did the Gamma Flip cross?
Study the close
The last 30-60 minutes often show concentrated flow as end-of-day positioning happens. Replay this period at 1x to see how GEX metrics shifted into the close. Useful for understanding next-day setups.
Compare multiple days
Replay the same ticker across 3-5 days. Patterns that hold across days are structural; patterns that only appear on one day are noise. Good GEX readers have pattern libraries built from dozens of replays.
📸 SCREENSHOT: replay-historical-gex-step-4.png
Walkthrough video
🎬 VIDEO: replay-historical-gex-walkthrough.mp4
Silent, about 60 seconds. Shows ticker and date selection, playback controls, and the two-chart view.
Common issues
The replay only covers recent days.
Historical depth depends on plan tier. GEX-plan subscribers typically get 30+ days of history; PRO gets longer. Sandbox accounts see a limited demo set.
The GEX levels on the price chart flicker during playback.
The levels update as open interest changes — sometimes many times per minute. What looks like flickering is the actual positioning data updating. Pause to read specific level values at a moment in time.
I don't see an interesting event during the session.
Not every session has dramatic GEX events. Boring sessions are useful for learning — they show what stable long-gamma trading looks like. For dramatic events, try Fed days, CPI days, earnings mornings, or OPEX Fridays.
Can I share a replay URL with someone?
Not directly. Each replay is generated per-user from the underlying data. You can describe a specific ticker and date, and anyone with access can reproduce the replay.
Can I export the replay as video?
No. Replay is interactive — there's no export to video today. Screenshots at key moments are the typical way to share observations.
How does Replay differ from looking at GEX AI with an old date?
GEX AI gives you a single snapshot for whatever date/time you query. Replay is the time series — scrubbable playback of the whole session. Use AI for "what does this moment look like"; use Replay for "how did we get here."
Related
- Understanding GEX and what it tells you
- How to use GEX AI for a ticker
- How to read the GEX Heatmap
- How to track gamma flip events and set alerts
Risk disclaimer: Options trading involves substantial risk of loss and is not suitable for all investors. Past performance does not guarantee future results. This content is for educational purposes only and is not investment advice.