The GEX Heatmap shows gamma exposure across strikes (vertical axis) and expirations (horizontal axis), with color intensity representing the magnitude of GEX at each point. Where GEX AI gives you the aggregated summary for a ticker, the Heatmap gives you the full 2D shape — how positioning concentrates at specific strike-expiration combinations, and how it changes across the term structure.
Before you start
Required:
- QuantWheel GEX or QuantWheel PRO subscription.
- Basic familiarity with GEX as a concept. See Understanding GEX if you're new.
Time to complete: 8 minutes
What's on the screen
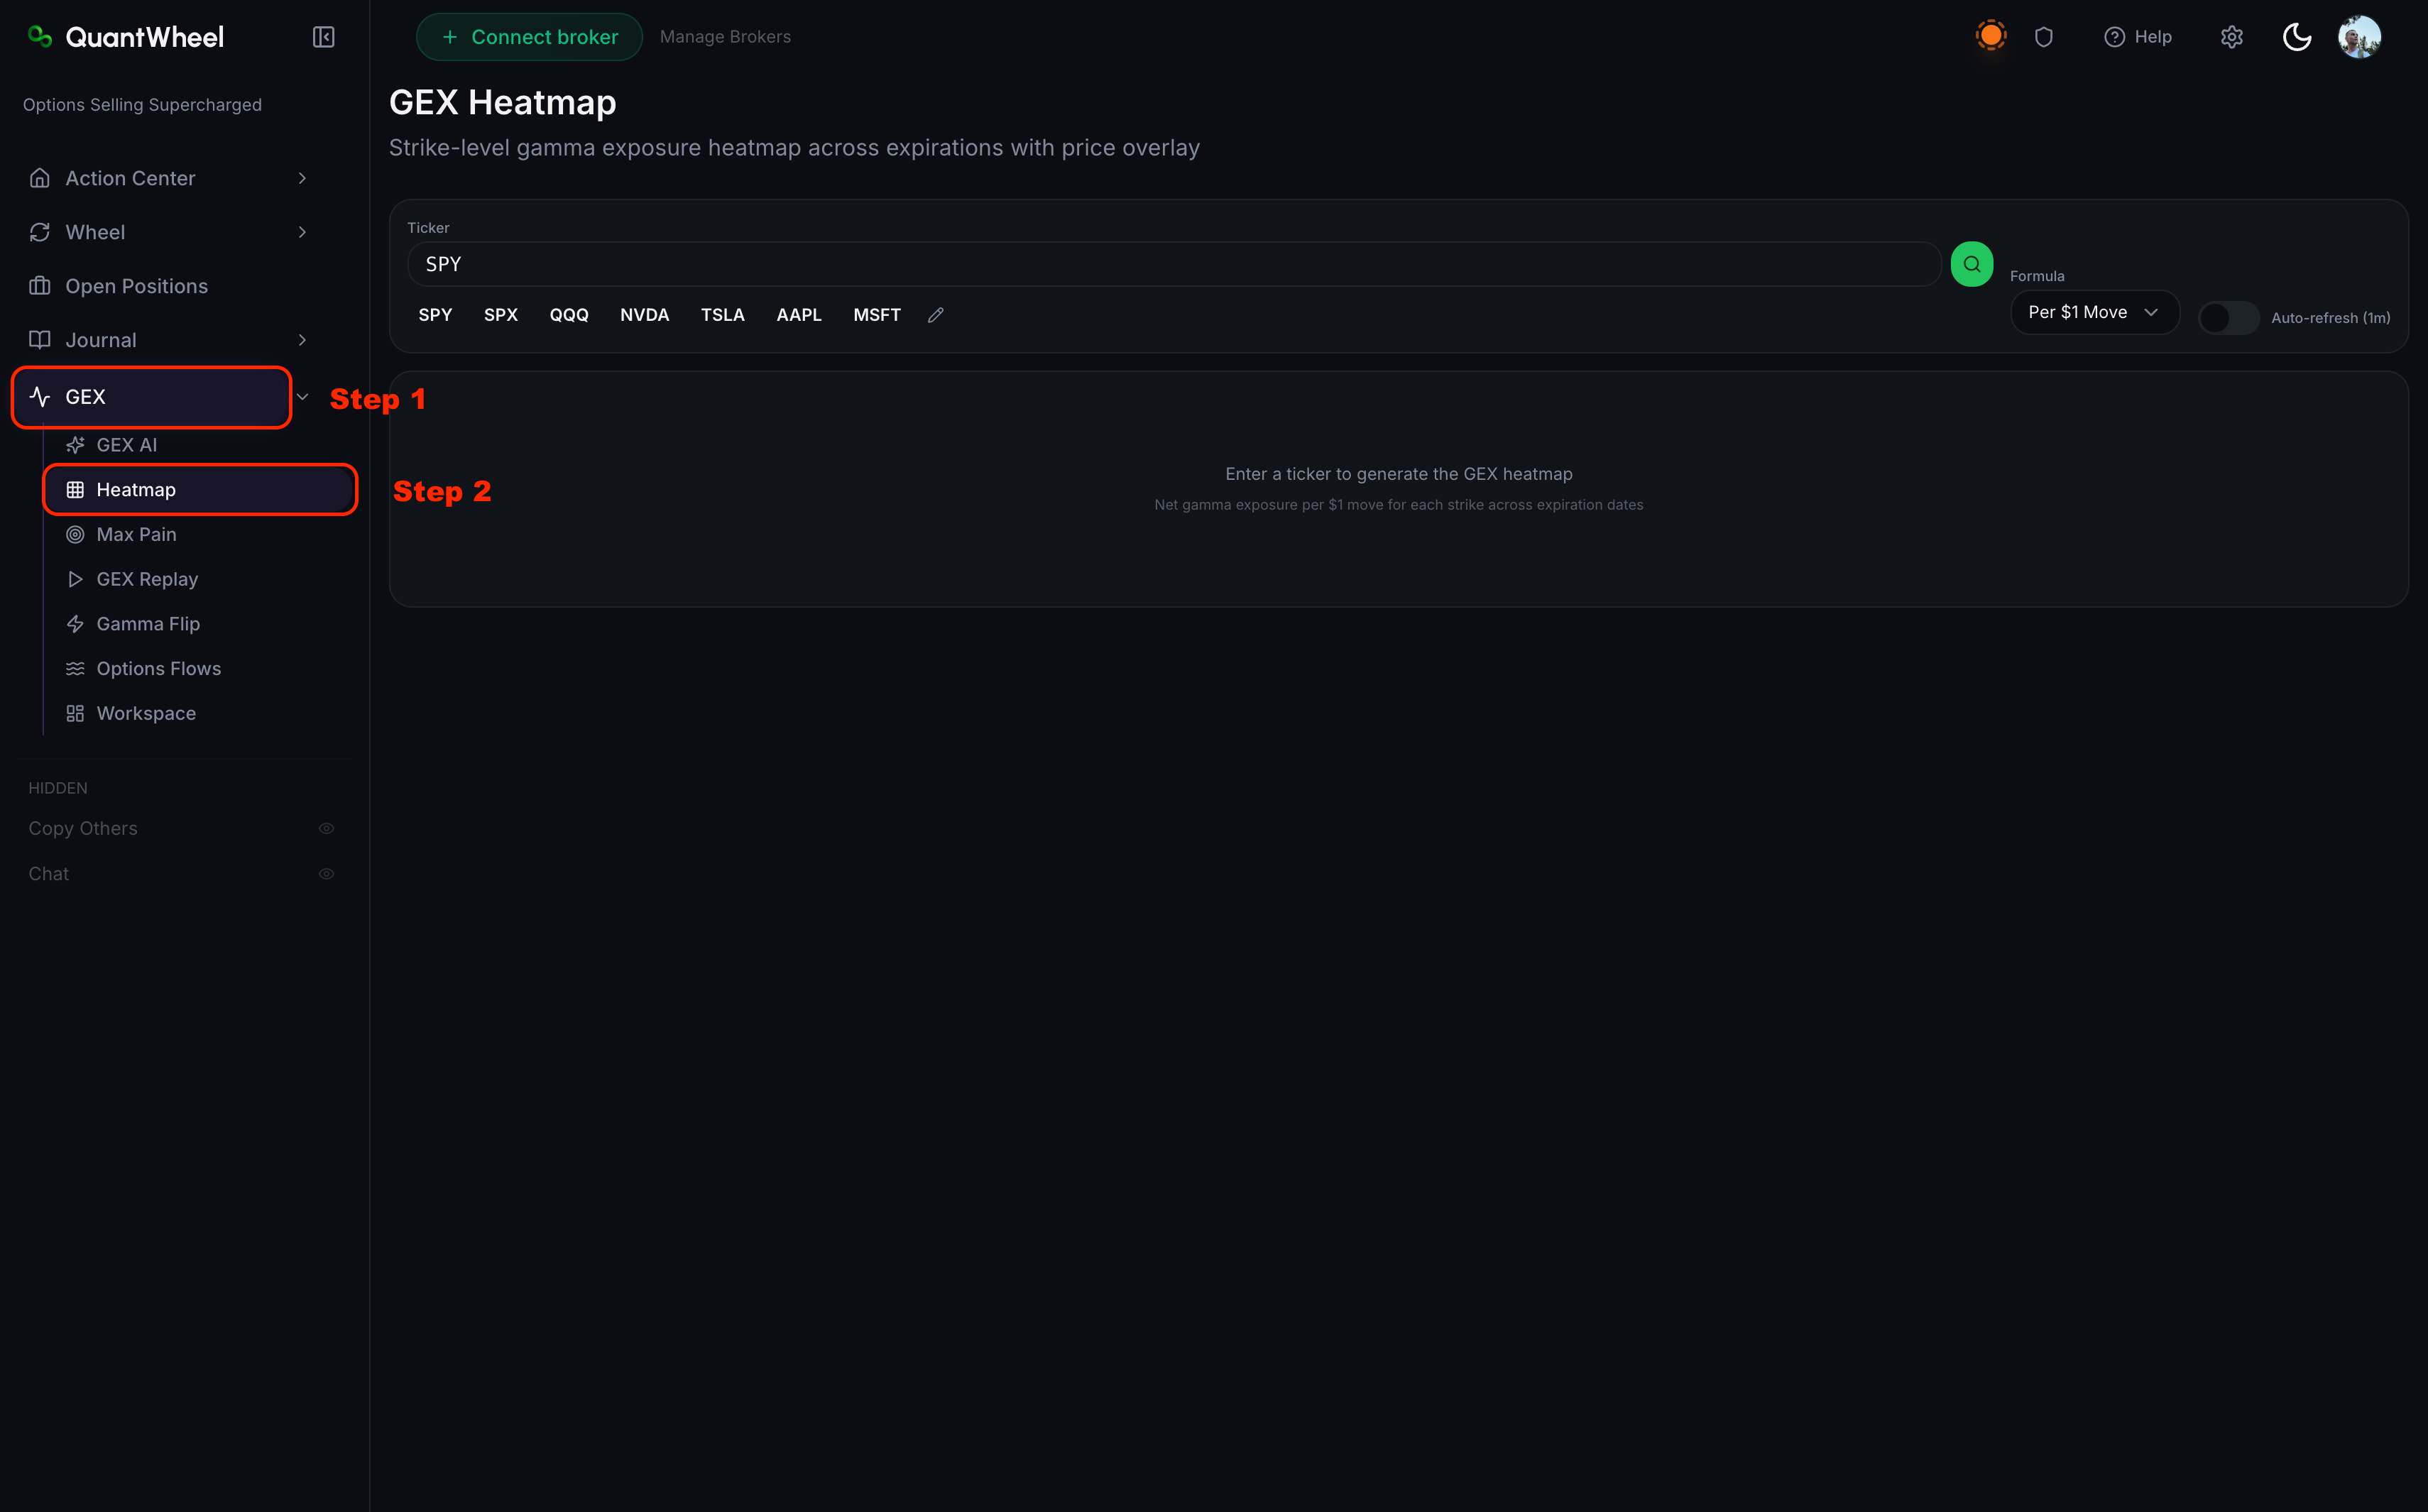
1. Controls at the top
- Ticker input + popular tickers — same convention as GEX AI; start with SPY, SPX, QQQ, NVDA, TSLA, or AAPL shortcut buttons, or type any ticker
- Formula toggle — typically "Per $1 Move" (the GEX-per-dollar formulation), though other formulations may be available
- Auto-refresh toggle — when on, the heatmap updates live as open interest changes during the session
- Levels overlay toggle — shows or hides the Key Level overlays on the chart below the heatmap
2. Key Levels sidebar
Alongside the heatmap, a sidebar lists the four structural levels for the selected ticker:
- Price — current underlying
- Call Wall — strike with largest call gamma
- Put Wall — strike with largest put gamma
- Gamma Flip — price level where dealer regime transitions
- Zone — the current GEX regime (typically labeled "Long Gamma" or "Short Gamma")
This sidebar mirrors the metric cards from GEX AI for quick cross-reference.
3. Net GEX by Expiry list
Below the Key Levels sidebar, a list shows the net GEX for each expiration in the selected window. Useful for spotting which expirations are driving the current gamma profile — a single big expiration can dominate the aggregate.
4. The main heatmap
The heatmap itself is a 2D grid:
- Y-axis (vertical): strikes, typically ~39 strikes in a standard view, centered on current price
- X-axis (horizontal): expirations, from nearest to farthest
- Color intensity: magnitude of GEX at each strike-expiration cell. Brighter colors = more gamma; dimmer = less.
- Color sign: positive (call) gamma vs. negative (put) gamma typically use different color scales so you can read direction at a glance.
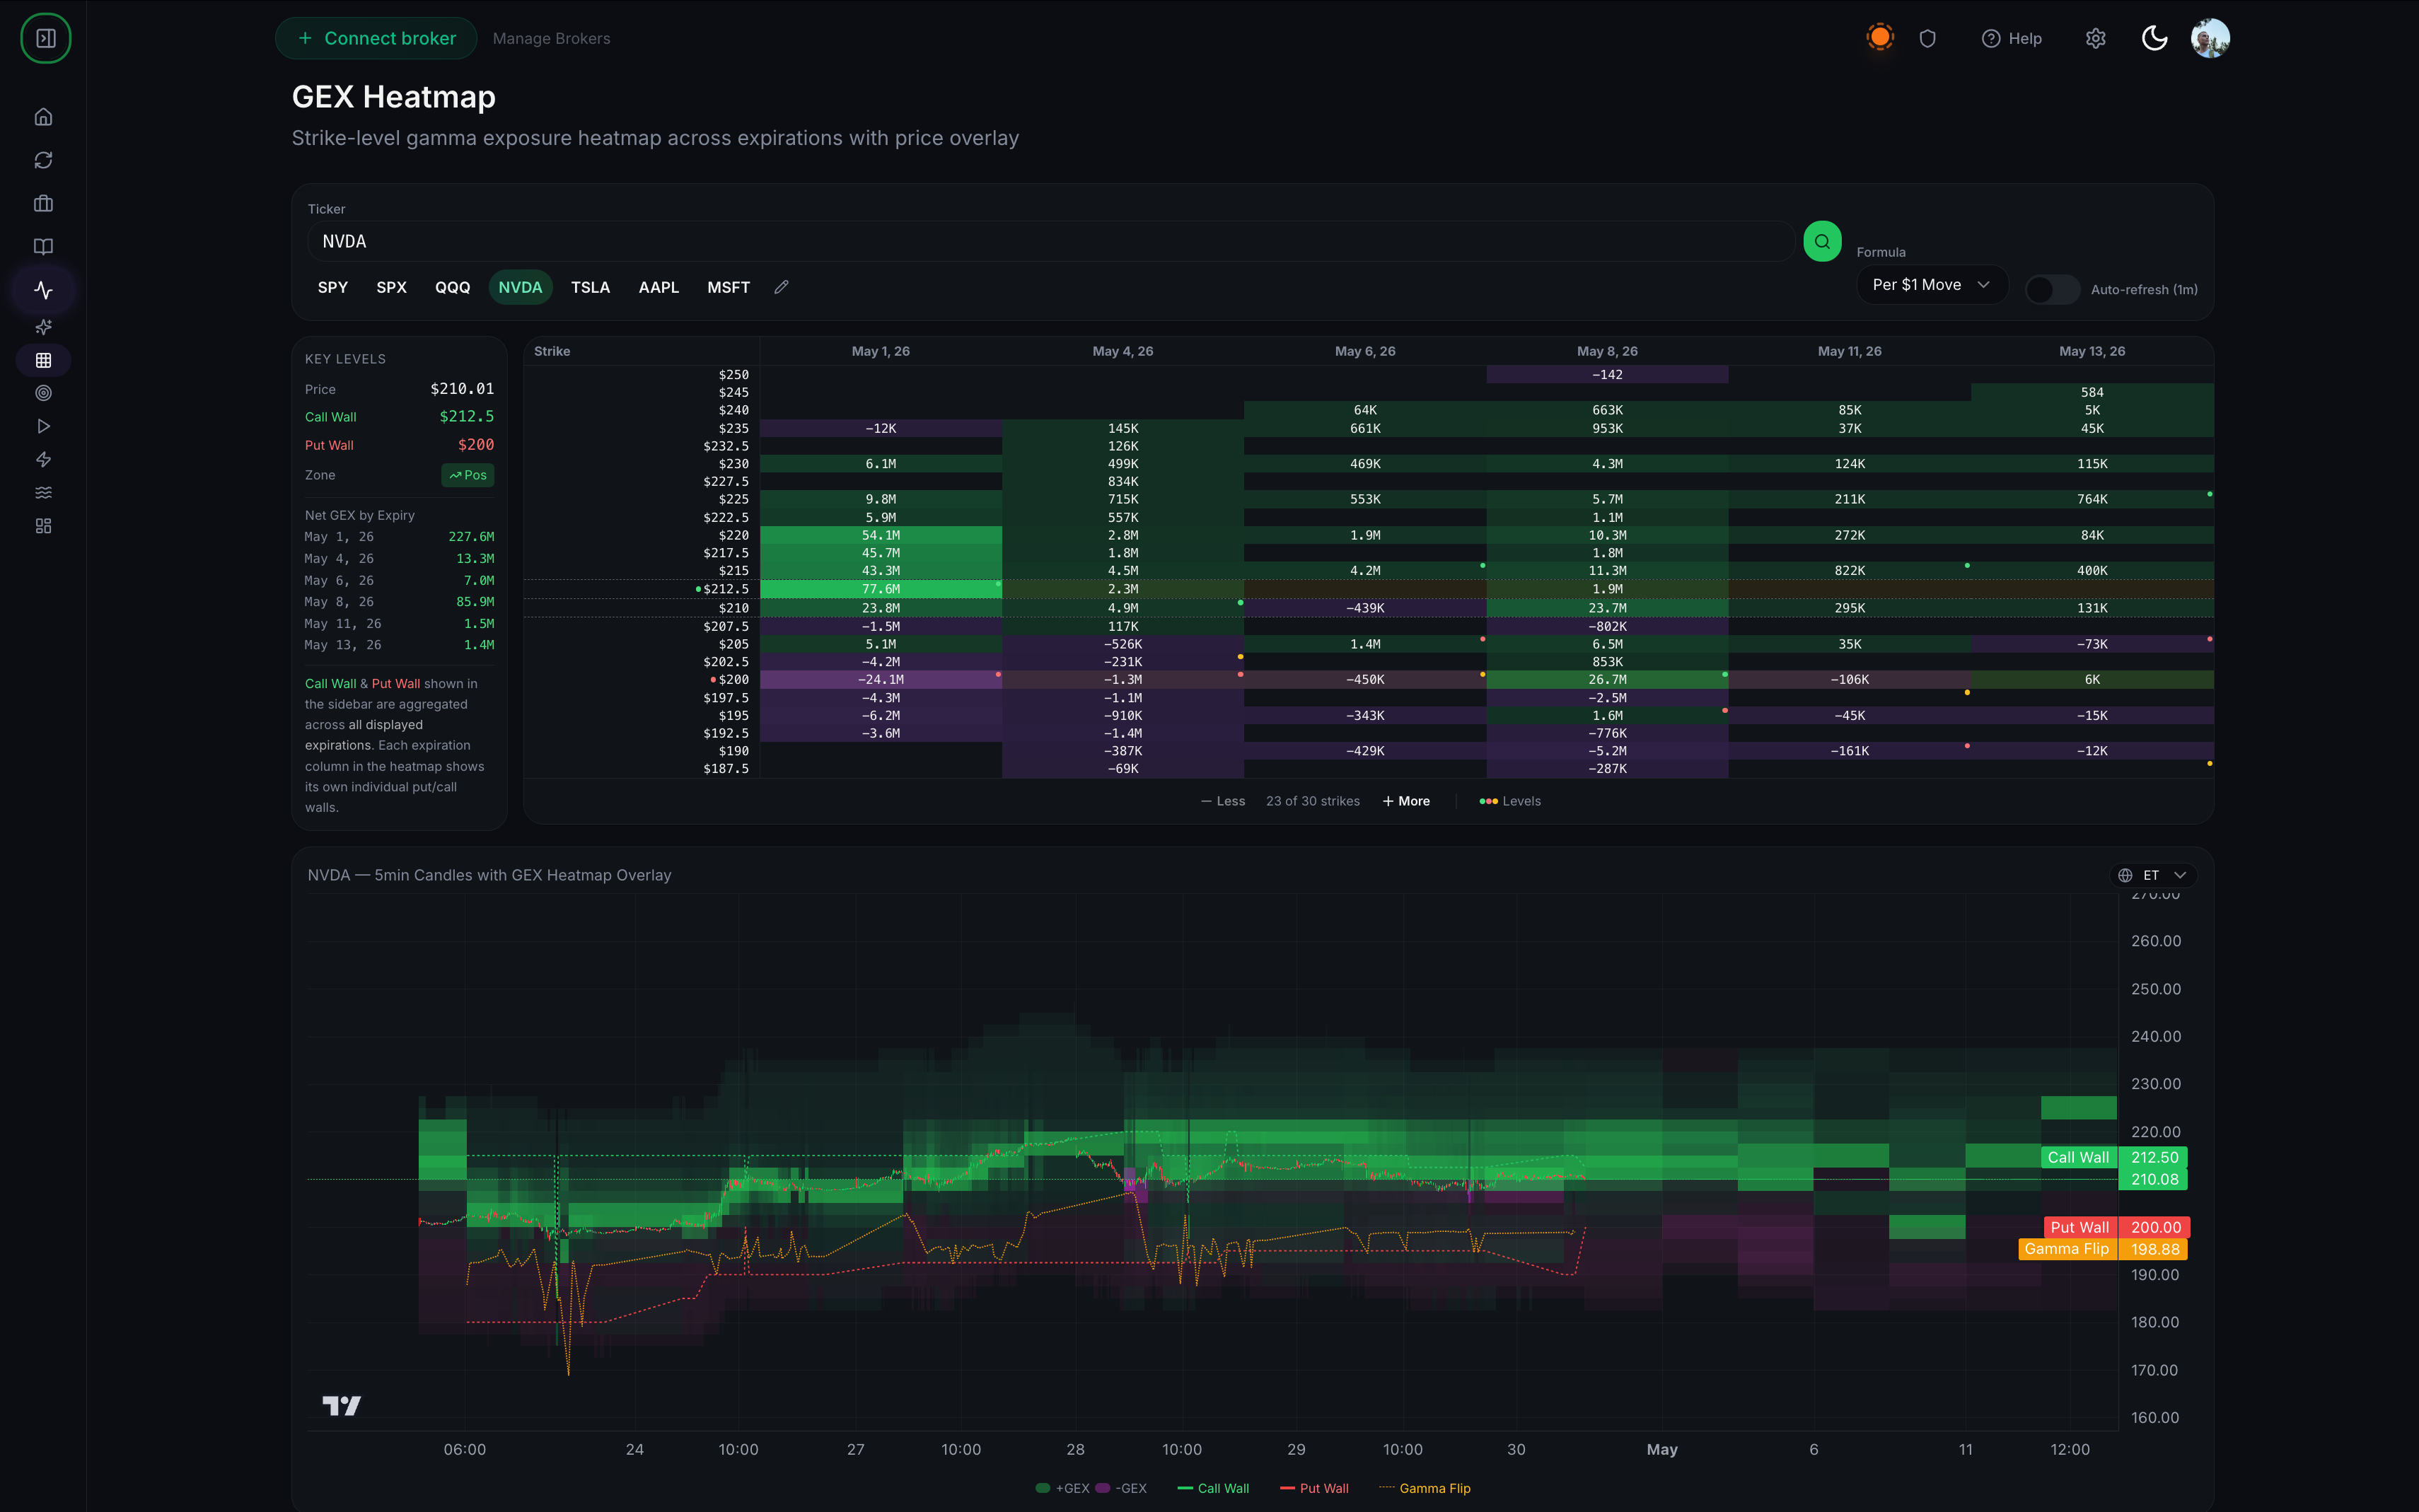
5. Strike zoom
Less/More controls adjust how many strikes are shown. Default is around 39 strikes — wide enough to see the full picture, narrow enough to keep each cell readable. Zoom in (fewer strikes) when you want detail near current price; zoom out when you want the full shape.
6. Price chart overlay (below the heatmap)
Below the main heatmap, a candlestick price chart shows the ticker's recent price action. Overlays can be toggled:
- Call Wall line — horizontal line at the Call Wall strike
- Put Wall line — horizontal line at the Put Wall strike
- Gamma Flip line — horizontal line at the Gamma Flip level
- GEX heatmap overlay — the heatmap data overlaid as background color on the price chart
This connects the positioning data (heatmap) with price action (candles) in one view.
How to read the heatmap
Look for clusters
The single most useful thing a heatmap shows is where gamma concentrates. A single bright cell on a specific strike-expiration — especially a near-term expiration — is a structural level dealers are heavily hedged around. Price tends to magnetize toward or repel from these concentrations depending on whether dealers are long or short at that strike.
Read horizontally for term structure
Scan left-to-right across a strike. If a strike has heavy gamma concentrated in near expirations but thin gamma in far expirations, that level matters for intraday but may not hold for the week. If gamma is consistent across expirations, the level has structural durability.
Read vertically for strike clustering
Scan top-to-bottom in a single expiration column. Multiple bright strikes close together indicate a range — dealer hedging is concentrated between strikes A and B, so price often trades in that band until the range breaks.
Use the price-chart overlay to gauge relevance
If current price sits inside a bright cluster, dealer hedging is active. If price has drifted outside the cluster, you're in a lower-gamma zone where hedging forces less constraint on price action — moves can be larger and more directional.
📸 SCREENSHOT: read-gex-heatmap-step-4.png
Common issues
The heatmap looks almost empty.
Either the ticker has light options activity (not enough open interest to generate visible gamma), or the formula/calculation is filtering out most of the data. Try a heavily-optioned ticker (SPY, SPX) first to confirm the view works, then investigate the thin ticker.
Colors are dim overall.
Normal for wide-strike views on moderately-optioned tickers. Zoom in with the strike-zoom controls to narrow the view and increase relative intensity.
Auto-refresh doesn't seem to update.
Open interest changes most visibly when large trades print. During quiet periods, the heatmap can look static for long stretches. Toggle auto-refresh off and on, or manually re-query the ticker if updates seem stuck.
The Gamma Flip level keeps moving.
That's normal. As option flow shifts through the day, the aggregate dealer positioning shifts too, and the flip level tracks it. A stable Gamma Flip across hours means flow has been balanced; big shifts indicate major one-sided flow (often around FOMC, CPI, or earnings).
How does the heatmap relate to GEX AI?
GEX AI aggregates into a summary; the Heatmap shows the underlying distribution. GEX AI gives you "Total GEX = X, Call Wall = $Y." The Heatmap shows you how the gamma is distributed across strikes and dates — the shape behind the summary. Use GEX AI to orient quickly; use Heatmap for deeper structure.
Should I use auto-refresh for active intraday trading?
If you're actively trading off GEX during the session, yes. The refresh overhead is minimal and you'll see positioning shifts as they happen. For end-of-day review, manual generation is fine.
Related
- Understanding GEX and what it tells you
- How to use GEX AI for a ticker
- Understanding call walls, put walls, and gamma flip
Risk disclaimer: Options trading involves substantial risk of loss and is not suitable for all investors. Past performance does not guarantee future results. This content is for educational purposes only and is not investment advice.