Technical filters add price-action context to an options screen. While the options filters tell you about the contract itself, technical filters tell you about the stock's behavior — whether it's trending, oversold, or pricing in unusually large moves. Use these to exclude tickers in conditions you don't want to trade, or to find tickers that fit a specific setup.
Before you start
Required:
- Familiarity with the Find Deals layout. See How to use the Find Deals screener.
- Simple/Advanced toggle set to Advanced (technical filters are Advanced-only).
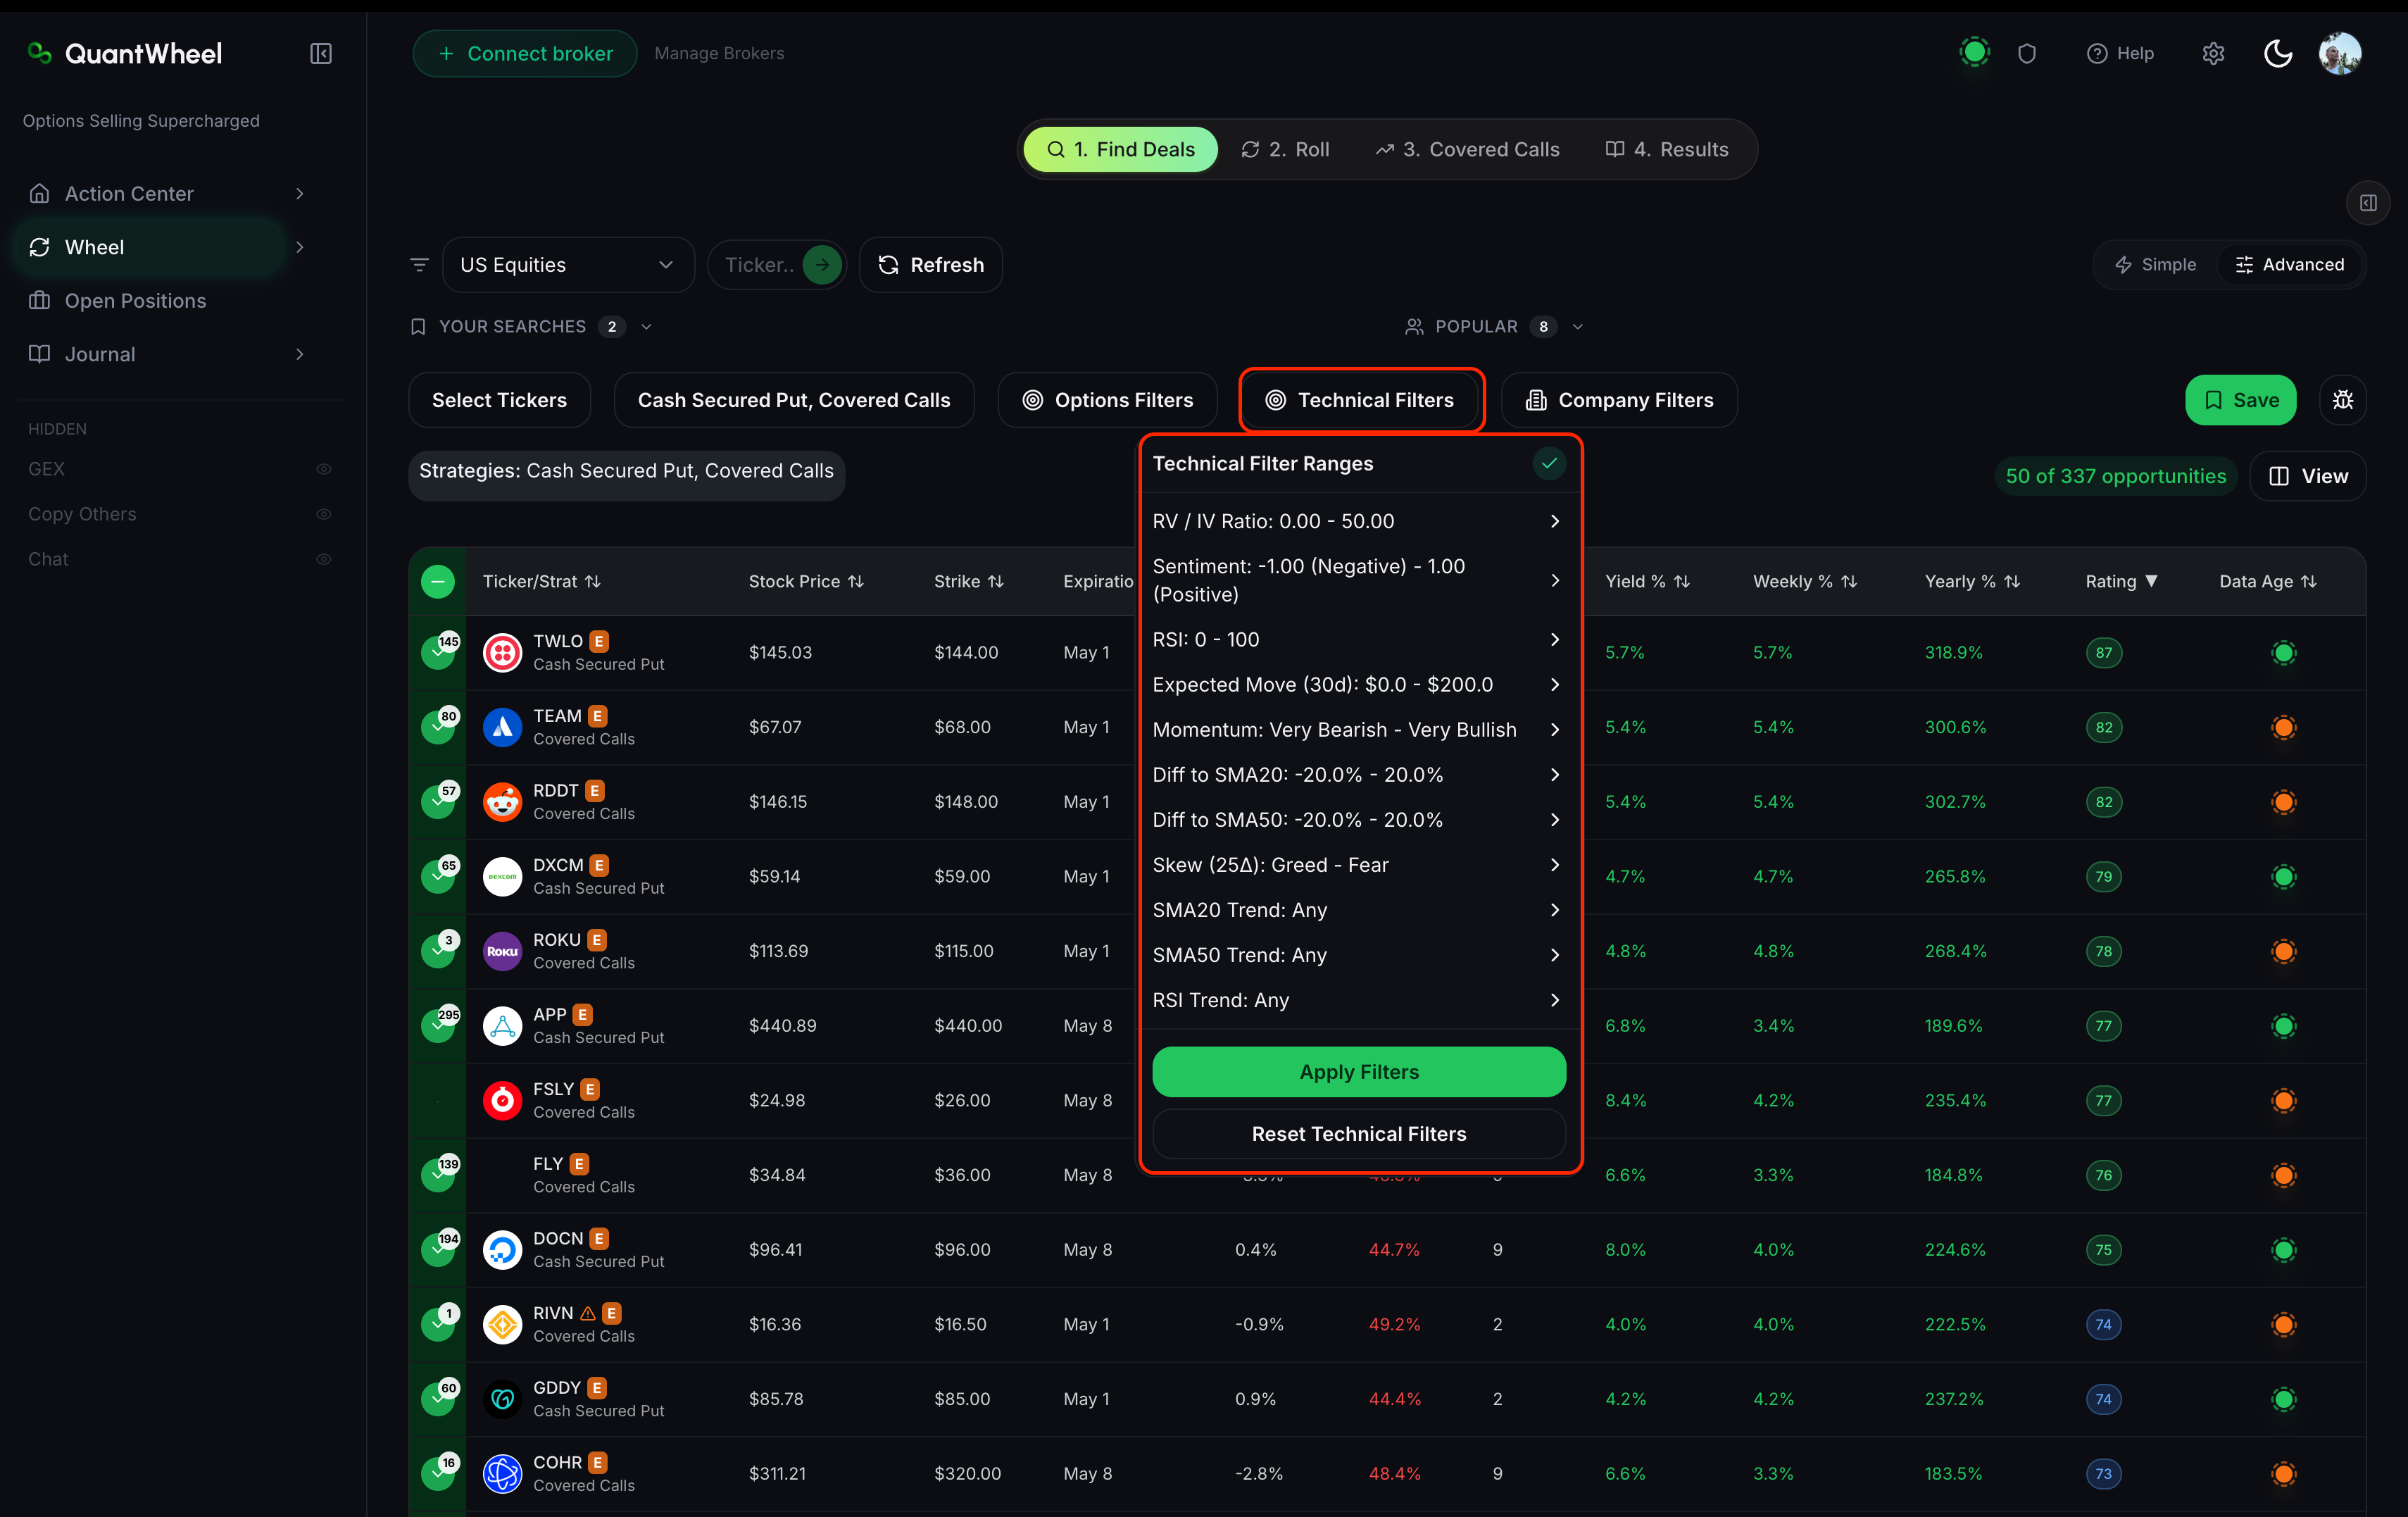
The 11 technical filters
RV/IV Ratio
What it is: Realized volatility divided by implied volatility. Realized volatility measures how much the stock has actually moved over a recent window; implied volatility is what options prices imply it will move going forward. The ratio compares the two.
In QuantWheel: A range filter. Values above 1.0 mean the stock has been more volatile than options priced in; below 1.0 means less volatile than priced.
How to use it: RV/IV below 1.0 favors option sellers — premiums are elevated relative to actual movement. Option sellers often filter for RV/IV below 0.8 or 0.9 to find contracts where IV is rich relative to what the stock is doing. Above 1.0 means premiums are low relative to actual volatility; less favorable for sellers.
Sentiment
What it is: An aggregated market-sentiment score for the ticker, typically derived from news, social chatter, or analyst activity.
In QuantWheel: A range filter or enumerated options (e.g., Bullish / Neutral / Bearish).
How to use it: For cash-secured puts, bearish sentiment on a ticker you otherwise like is a reason to tighten filters or skip — the crowd's caution may be right. For covered calls, strong bullish sentiment above your strike suggests early called-away risk. Use Sentiment as a gut-check filter, not a primary driver.
RSI (Relative Strength Index)
What it is: A 0–100 momentum oscillator. Values above 70 are conventionally "overbought," below 30 "oversold." The standard lookback is 14 periods.
In QuantWheel: A range filter. Values from 0 to 100.
How to use it: For CSPs, oversold tickers (RSI < 30) are sometimes attractive — the stock has already fallen, and selling a put below current price has more cushion than selling into a high. But oversold can stay oversold. Conservative wheel traders filter RSI between 35 and 65 to stay out of both extremes.
Expected Move (30d)
What it is: The market-implied range the stock is expected to trade within over the next 30 days, derived from options prices. Typically expressed as a dollar amount or percentage.
In QuantWheel: A range filter.
How to use it: Expected Move tells you how much room the market gives the stock. A CSP struck outside the Expected Move range has, by options-market implication, a lower probability of ending in the money. Combined with Delta, Expected Move gives you a second read on assignment odds.
Momentum
What it is: A measure of the stock's rate of price change over a recent window — typically the percentage change over 3, 6, or 12 months.
In QuantWheel: A range filter. Positive values indicate uptrend; negative indicate downtrend.
How to use it: Strong positive momentum on CSP candidates is generally favorable — the stock is trending up, so selling puts below current price has extra cushion. Strong negative momentum is a warning sign; you might collect premium but take assignment on a stock still falling. Conservative wheels filter for positive Momentum; aggressive or contrarian wheels deliberately hunt negative Momentum for the higher premium.
Diff to SMA20
What it is: The percentage difference between the current price and the 20-day simple moving average. Positive means the stock is above its short-term average.
In QuantWheel: A range filter.
How to use it: Short-term trend context. Stocks trading 5%+ above SMA20 are in short-term uptrends; 5%+ below are in short-term downtrends. Setting "Diff to SMA20 > 0" restricts to stocks that are, at minimum, not in a short-term decline.
Diff to SMA50
What it is: The percentage difference between the current price and the 50-day simple moving average. Positive means above medium-term average.
In QuantWheel: A range filter.
How to use it: Medium-term trend context. More durable than SMA20 — a stock can dip below SMA20 briefly in a larger uptrend, but sustained time below SMA50 is a more meaningful bear signal. Combining SMA20 and SMA50 filters creates a classic trend-confirmation screen.
SMA20 Trend
What it is: The direction the 20-day moving average itself is moving. Up, flat, or down.
In QuantWheel: An enumerated filter with direction options.
How to use it: Unlike Diff to SMA20 (which tells you where price sits relative to the average), SMA20 Trend tells you where the average is going. A stock can be above a falling SMA20 — price trending sideways while the average catches up. Use SMA20 Trend to insist on a rising short-term average, not just price above it.
SMA50 Trend
What it is: The direction of the 50-day moving average.
In QuantWheel: An enumerated filter with direction options.
How to use it: Same logic as SMA20 Trend, but for the medium-term average. A rising SMA50 is one of the most reliable "stock is in a healthy uptrend" signals, and it's slow to turn — a stock in a sustained decline will have a falling SMA50 for weeks before the trend fully reverses.
RSI Trend
What it is: The direction RSI is moving — rising, flat, or falling.
In QuantWheel: An enumerated filter with direction options.
How to use it: RSI value tells you where momentum sits; RSI Trend tells you where it's going. A stock with RSI 45 and rising is strengthening; RSI 55 and falling is weakening. Combine RSI range filters with RSI Trend to find stocks that are transitioning in the direction you want.
Skew (25Δ)
What it is: The implied-volatility difference between a 25-delta put and a 25-delta call at the same expiration. A measure of whether options traders are paying up more for downside protection (high put IV) or upside exposure (high call IV).
In QuantWheel: A range filter. Positive skew means puts are more expensive than calls.
How to use it: High positive skew means the market is pricing in more downside fear — good for CSP sellers (you collect inflated put premiums) but also a signal the market expects trouble. Low skew or inverted skew (calls priced higher than puts) is unusual and often accompanies euphoric markets or rallies. For wheel traders, elevated but not extreme skew (moderately positive) is the sweet spot.
Common issues
Combining all technical filters returns almost nothing.
Technical filters compound aggressively. Three or four active technical filters together can exclude 90%+ of candidates that would otherwise pass the options filters. Pick one or two technical filters per screen to add meaningful context without over-narrowing.
Which technical filter matters most?
No universal answer — it depends on strategy. For premium-hunting screens, RV/IV Ratio and Skew are the most options-aware filters. For trend-aware screens, Diff to SMA50 plus SMA50 Trend is a strong pair. For contrarian screens, RSI and Sentiment do the work.
Sentiment feels subjective. How reliable is it?
Sentiment indicators are aggregates, and aggregates smooth out individual errors but don't eliminate them. Use Sentiment as a tiebreaker between two otherwise-equivalent candidates, not as a primary filter.
I don't know what Skew should look like. What's normal?
For most major US stocks, 25-delta put IV runs 2–6 points above 25-delta call IV — that's "normal" positive skew. Zero or negative skew is unusual. Very high skew (8+ points) often accompanies market stress.
Related
- How to use the Find Deals screener
- How to filter by options metrics
- How to filter by company fundamentals
- How to save and reuse filter combinations
Risk disclaimer: Options trading involves substantial risk of loss and is not suitable for all investors. Past performance does not guarantee future results. This content is for educational purposes only and is not investment advice.